We use cookies to enhance the usability of our website. If you continue, we'll assume that you are happy to receive all cookies. More information. Don't show this again.
On the top, protein expression in current human tissue, based on all annotated cell types, is reported with the units not detected (n), low (l), medium (m) and high (h). Underneath, protein expression in each annotated cell type are reported using the same units.
Protein expression data is based on knowledge-based annotation. For genes where more than one antibody has been used, a collective score is set.
If knowledge-based annotation could not be performed for a gene, no data is displayed here. View antibody staining data further down this page.
A summary of mRNA expression data available for current tissue based on several datasets. The mRNA expression levels in human tissues are based on RNA-seq data generated by the Human Protein Atlas (HPA), Genotype-Tissue Expression (GTEx) portal and CAGE data generated by the FANTOM5 consortium. Consensus normalized expression (NX) levels for human tissues was created by combining the data from these three transcriptomics datasets (HPA, GTEx and FANTOM5).
The mRNA expression levels in pig are based on RNA-seq data generated by the Human Protein Atlas (HPA), and for mouse, HPA data and in situ hybridization generated by the Allen brain atlas are reported.
Scroll down to view mRNA expression data in more detail.
The RNA-seq details section shows detailed information about the individual samples used for the transcript profiling and results of the RNA-seq analysis.
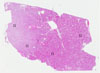
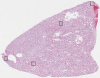
Information about each individual sample is listed below, including gender, age, a tissue section image and estimated fractions of cell types. pTPM (transcripts per million) values give a quantification of the gene abundance which is comparable between different genes and samples.
Cells in tubules: 60 Cells in glomeruli: 20 Fibroblasts: 5 Other cell types: 15
Female, age 67
Kidney sample 56 pTPM: 6232.9
Cell types%
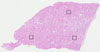
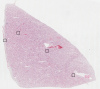
Cells in tubules: 70 Cells in glomeruli: 15 Fibroblasts: 10 Other cell types: 5
Female, age 55
Kidney sample 57 pTPM: 1525.1
Cell types%
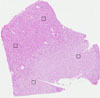
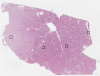
Cells in tubules: 80 Cells in glomeruli: 10 Fibroblasts: 5 Other cell types: 5
Male, age 46
Kidney sample 58 pTPM: 2146.5
Cell types%
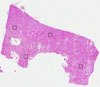
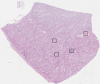
Cells in tubules: 60 Cells in glomeruli: 25 Fibroblasts: 5 Other cell types: 10
Female, age 57
Kidney sample 358 pTPM: 622.5
Cell types%
Cells in tubules: 60 Cells in glomeruli: 10 Fibroblasts: 10 Other cell types: 20
Male, age 78
Kidney sample 377 pTPM: 2108.9
Cell types%
Cells in tubules: 65 Cells in glomeruli: 10 Fibroblasts: 5 Other cell types: 20
Male, age 73
Kidney sample 380 pTPM: 6263.3
Cell types%
Cells in tubules: 60 Cells in glomeruli: 10 Fibroblasts: 10 Other cell types: 20
Female, age 59
Kidney sample 394 pTPM: 1045.1
Cell types%
Cells in tubules: 65 Cells in glomeruli: 10 Fibroblasts: 10 Other cell types: 15
Female, age 48
Kidney sample 414 pTPM: 587.4
Cell types%
Cells in tubules: 60 Cells in glomeruli: 5 Fibroblasts: 10 Other cell types: 25
KIDNEY - GTEx RNA-seqi
RNA-Seq data generated by the Genotype-Tissue Expression (GTEx) project from human tissues is reported as average pTPM. More information can be found on the GTEx portal.
Distribution across the dataset is visualized with box plots, shown as median and 25th and 75th percentiles. Points are displayed as outliers if they are above or below 1.5 times the interquartile range. pTPM values of the individual samples are presented next to the box plot.
Max pTPM: 10468.1
Min pTPM: 70.7
Std pTPM: 2558.7
Median pTPM: 850.3
GTEX-13NYB-1726-SM-5N9G2
40-49 years, male
10468.1
GTEX-N7MS-1626-SM-3LK5F
60-69 years, male
9915.2
GTEX-14C5O-2026-SM-5YYB1
60-69 years, male
9269.3
GTEX-16MT8-1926-SM-7EPGL
60-69 years, female
6515.7
GTEX-13RTJ-2226-SM-5S2Q1
60-69 years, male
5099.2
GTEX-17HHY-2326-SM-7KFSR
50-59 years, male
4129.8
GTEX-1BAJH-1826-SM-731DA
70-79 years, male
4058.2
GTEX-15CHQ-2126-SM-6871M
60-69 years, male
3450.7
GTEX-11OF3-1326-SM-5N9FJ
60-69 years, male
3200.5
GTEX-14E6D-2526-SM-5YYA9
50-59 years, male
2670.2
GTEX-T5JC-1526-SM-4DM68
20-29 years, male
2583.7
GTEX-13OW6-1826-SM-5N9F9
50-59 years, male
2519.3
GTEX-12WSG-0826-SM-5EQ5A
50-59 years, female
2433.3
GTEX-ZC5H-1726-SM-5HL7X
40-49 years, female
2198.9
GTEX-145MN-0326-SM-5QGQI
30-39 years, male
1817.6
GTEX-QDVN-1626-SM-48TZC
50-59 years, male
1608.9
GTEX-ZDXO-0226-SM-4WKH7
60-69 years, male
1348.8
GTEX-1A3MW-2226-SM-73KUX
60-69 years, female
1013.7
GTEX-15DYW-2026-SM-6AJBD
60-69 years, female
982.1
GTEX-1AX8Z-2326-SM-731CR
60-69 years, male
976.6
GTEX-XPVG-0526-SM-4B65N
50-59 years, male
972.9
GTEX-1C6VQ-2326-SM-7IGN1
50-59 years, male
891.0
GTEX-13OVL-1826-SM-5KLZR
50-59 years, male
850.3
GTEX-QLQW-1626-SM-4R1K1
30-39 years, male
846.0
GTEX-ZYFG-1626-SM-5GZYY
60-69 years, female
767.4
GTEX-11GS4-2326-SM-5A5KS
60-69 years, male
742.4
GTEX-17F97-1926-SM-7IGM4
50-59 years, male
719.7
GTEX-ZYT6-2226-SM-5GIC9
30-39 years, male
611.2
GTEX-1497J-0826-SM-5NQAJ
60-69 years, male
583.6
GTEX-1EKGG-2226-SM-7IGOA
60-69 years, male
576.9
GTEX-1399S-0526-SM-5IJG8
30-39 years, female
569.2
GTEX-14C39-2126-SM-664OH
40-49 years, male
568.8
GTEX-13OVI-1126-SM-5KLZF
60-69 years, female
505.7
GTEX-Y5V6-2026-SM-5IFHO
60-69 years, male
468.7
GTEX-13O1R-2526-SM-5N9FW
60-69 years, male
352.3
GTEX-NPJ8-2226-SM-3TW8D
40-49 years, male
334.7
GTEX-13112-2126-SM-5GCO4
50-59 years, male
306.7
GTEX-ZLFU-0926-SM-5P9F8
40-49 years, male
287.6
GTEX-12696-0926-SM-5FQTV
60-69 years, male
231.9
GTEX-11TTK-1926-SM-5PNW8
60-69 years, female
152.6
GTEX-P4QS-1126-SM-3NMD5
60-69 years, male
124.5
GTEX-147F4-2626-SM-5Q5CS
50-59 years, male
115.8
GTEX-ZVZP-0926-SM-5GIDB
50-59 years, male
89.6
GTEX-ZE9C-1426-SM-4WKGM
60-69 years, male
85.9
GTEX-RN64-1626-SM-48FD7
50-59 years, male
70.7
Show allShow less
KIDNEY - FANTOM5 CAGEi
RNA expression in human tissues obtained through Cap Analysis of Gene Expression (CAGE) generated by the FANTOM5 project are reported as Scaled Tags Per Million.
 The Human Protein Atlas project is funded


 MENU
MENU