|
TISSUE ATLASPRIMARY DATASALIVARY GLANDGENE/PROTEIN
ANTIBODIES
AND VALIDATION 
Dictionary
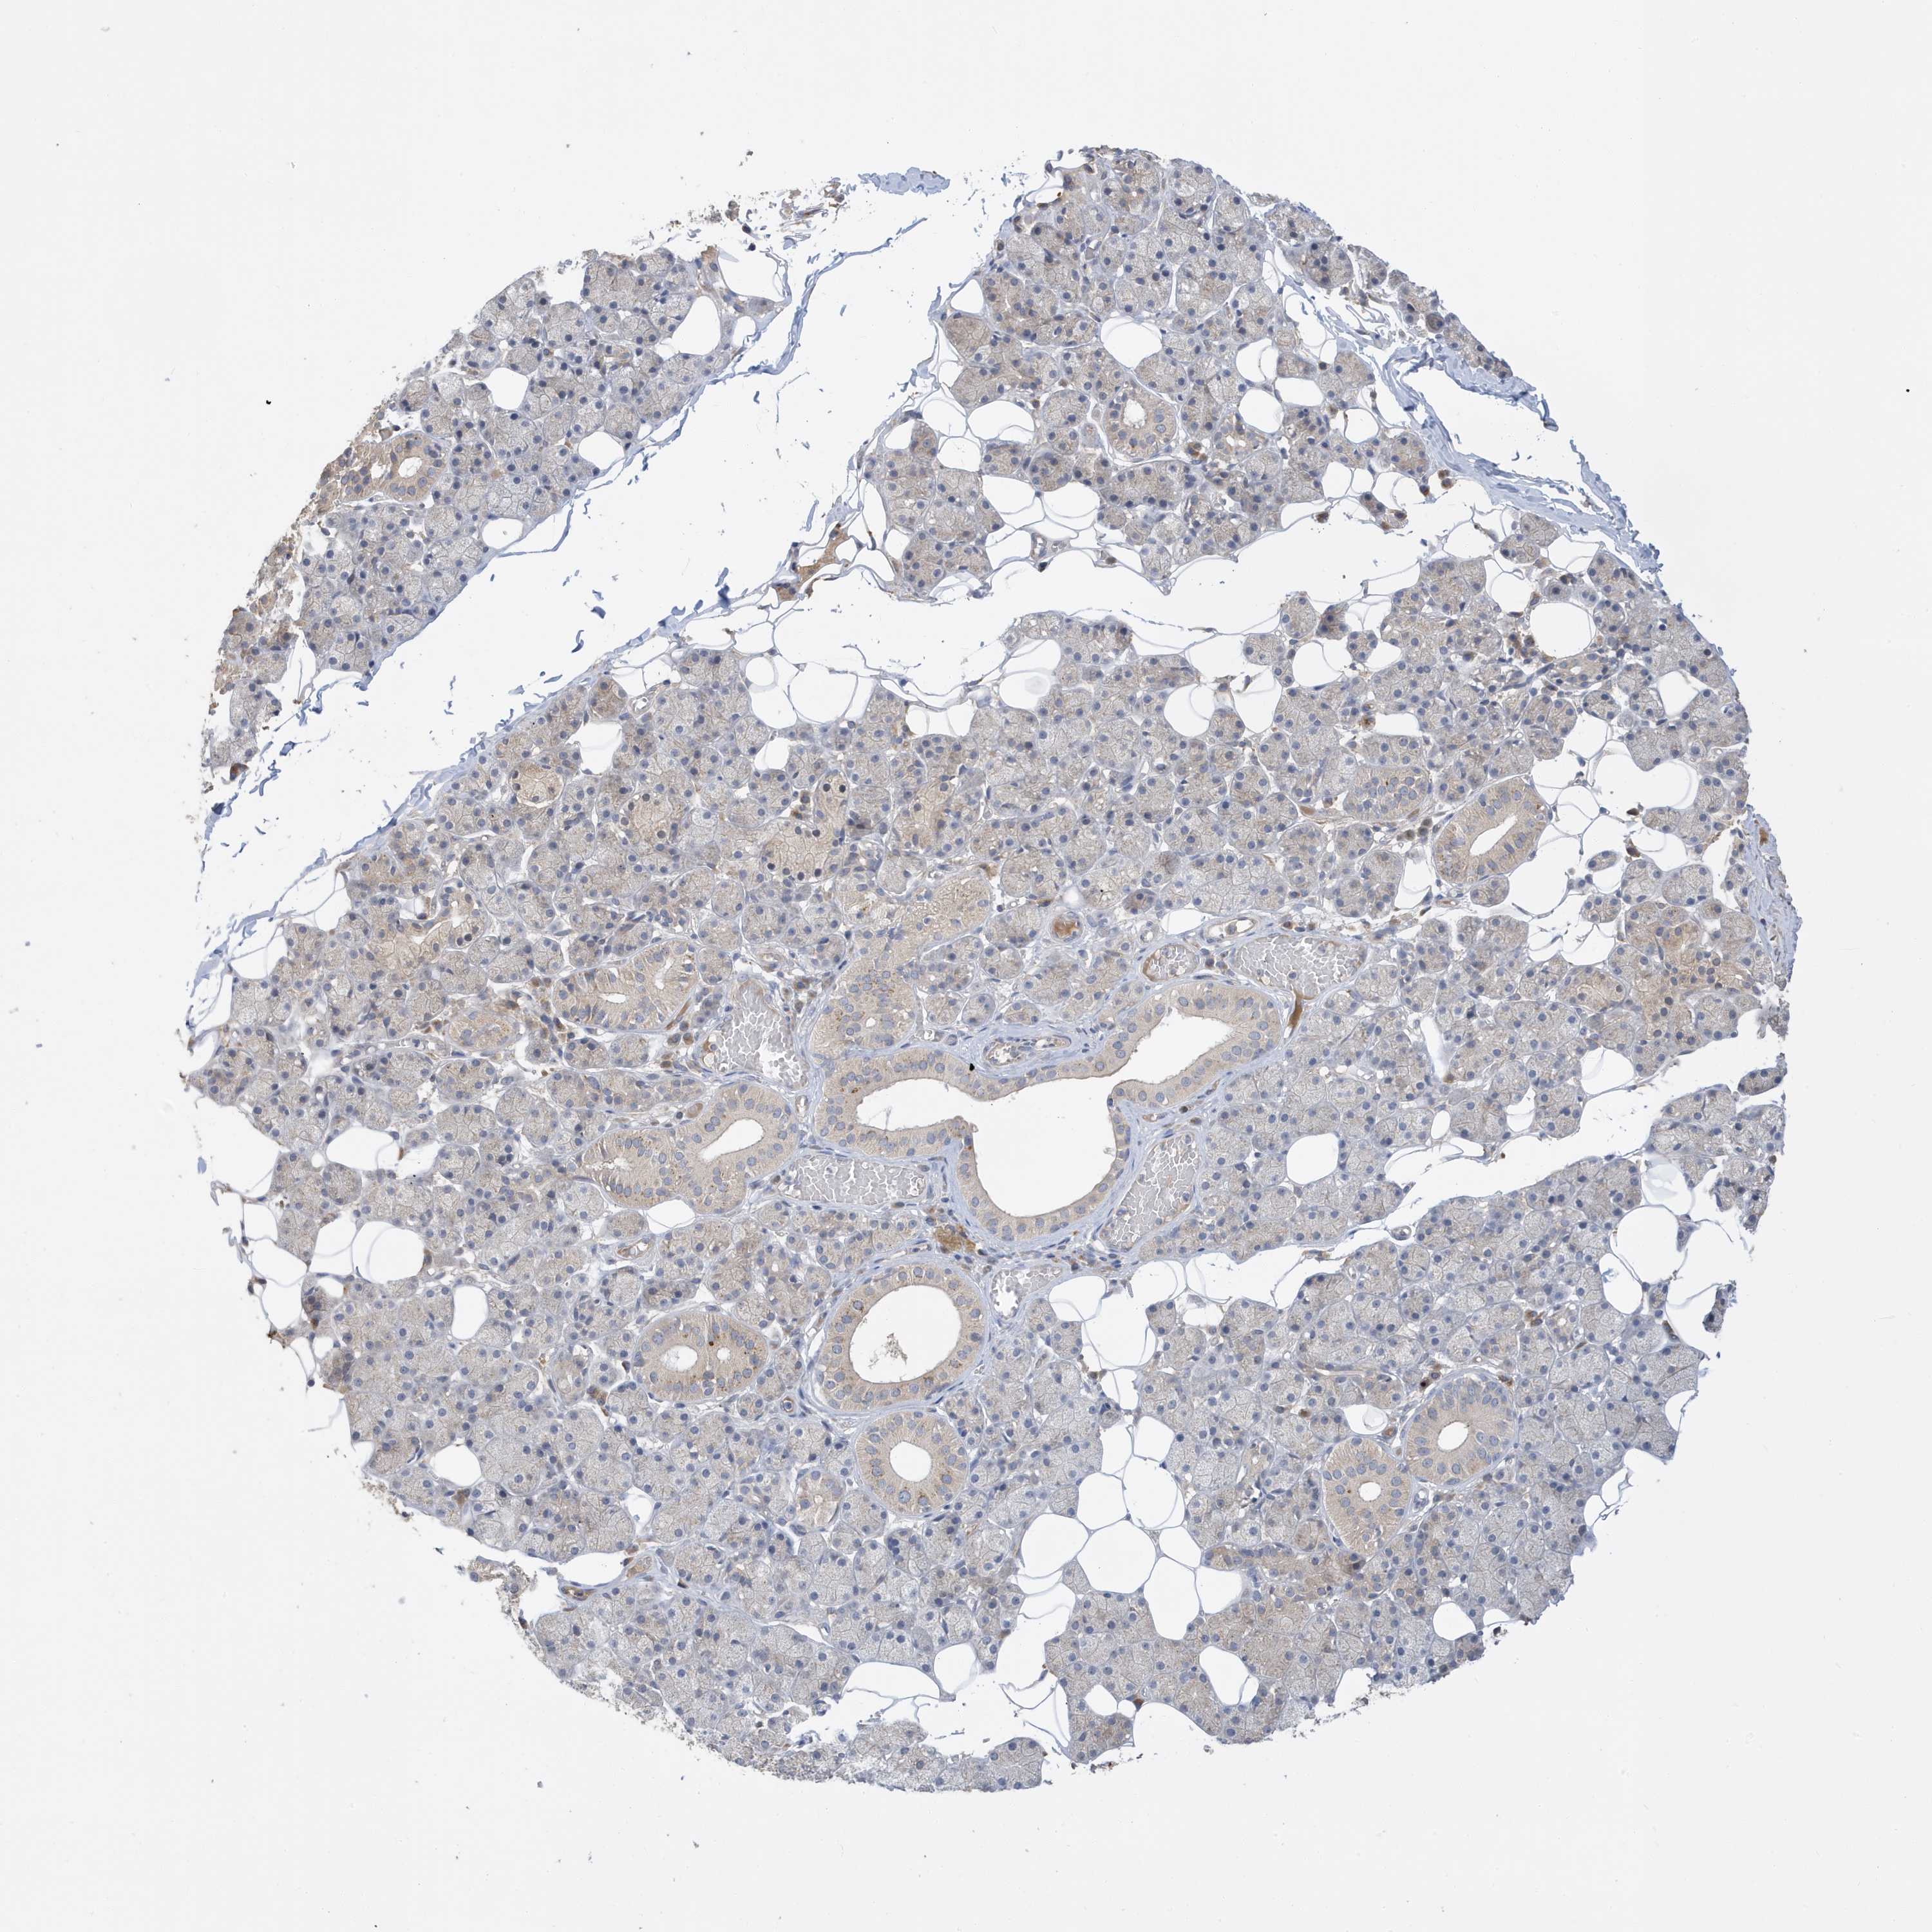
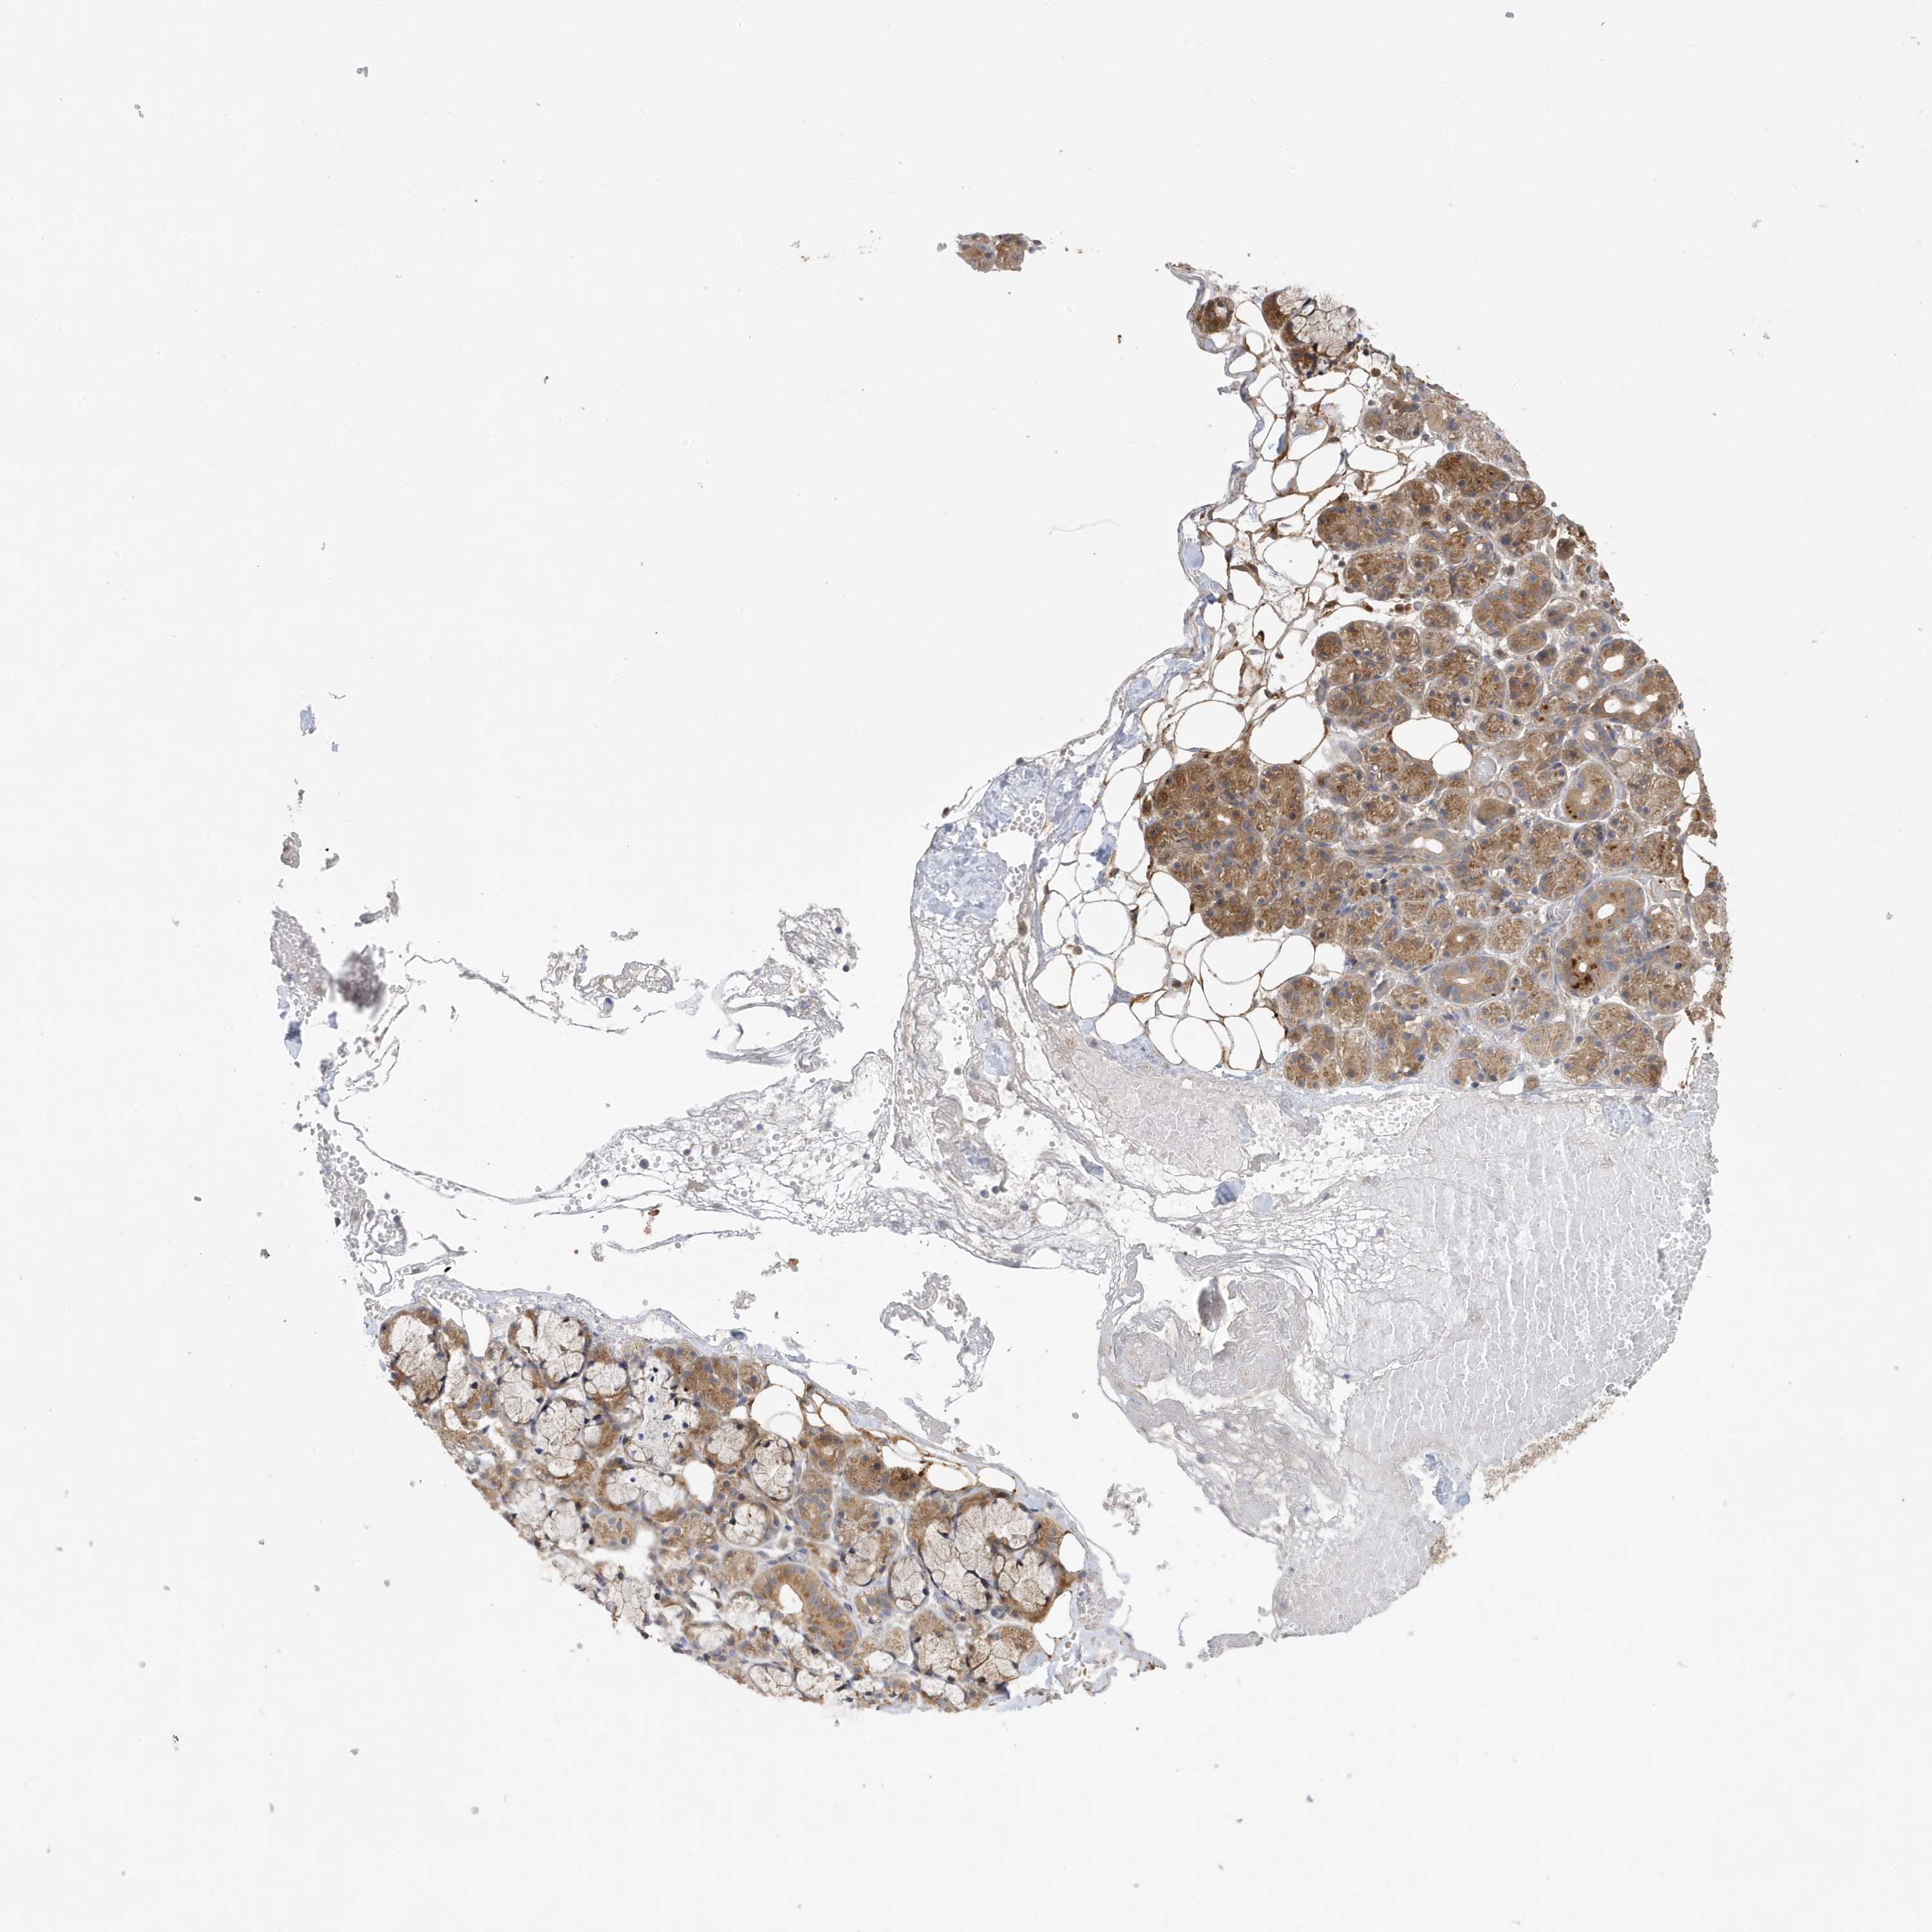
Salivary gland
Tissue proteome
Salivary gland |
|
|||||||||||||||||||||||||||||||||||||||||||||||||||||||||||||||||||||||||||||||||||||||||||||||||||||||||||||||||||||
The Project
The Human Protein Atlas
 The Human Protein Atlas project is funded


 MENU
MENU