We use cookies to enhance the usability of our website. If you continue, we'll assume that you are happy to receive all cookies. More information. Don't show this again.
On the top, protein expression in current human tissue, based on all annotated cell types, is reported with the units not detected (n), low (l), medium (m) and high (h). Underneath, protein expression in each annotated cell type are reported using the same units.
Protein expression data is based on knowledge-based annotation. For genes where more than one antibody has been used, a collective score is set.
If knowledge-based annotation could not be performed for a gene, no data is displayed here. View antibody staining data further down this page.
A summary of mRNA expression data available for current tissue based on several datasets. The mRNA expression levels in human tissues are based on RNA-seq data generated by the Human Protein Atlas (HPA), Genotype-Tissue Expression (GTEx) portal and CAGE data generated by the FANTOM5 consortium. Consensus normalized expression (NX) levels for human tissues was created by combining the data from these three transcriptomics datasets (HPA, GTEx and FANTOM5).
The mRNA expression levels in pig are based on RNA-seq data generated by the Human Protein Atlas (HPA), and for mouse, HPA data and in situ hybridization generated by the Allen brain atlas are reported.
Scroll down to view mRNA expression data in more detail.
The RNA-seq details section shows detailed information about the individual samples used for the transcript profiling and results of the RNA-seq analysis.
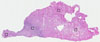
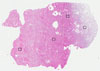
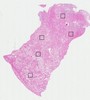
Information about each individual sample is listed below, including gender, age, a tissue section image and estimated fractions of cell types. pTPM (transcripts per million) values give a quantification of the gene abundance which is comparable between different genes and samples.
RNA-Seq data generated by the Genotype-Tissue Expression (GTEx) project from human tissues is reported as average pTPM. More information can be found on the GTEx portal.
Distribution across the dataset is visualized with box plots, shown as median and 25th and 75th percentiles. Points are displayed as outliers if they are above or below 1.5 times the interquartile range. pTPM values of the individual samples are presented next to the box plot.
Max pTPM: 3728.3
Min pTPM: 1611.8
Std pTPM: 605.4
Median pTPM: 2374.8
GTEX-XV7Q-1526-SM-4BRWB
40-49 years, female
3728.3
GTEX-S32W-1426-SM-4AD66
50-59 years, female
3403.1
GTEX-P78B-2526-SM-3P5ZY
40-49 years, female
3350.8
GTEX-ZTPG-2026-SM-5O999
20-29 years, female
3150.4
GTEX-PWCY-1426-SM-48TCT
20-29 years, female
2928.9
GTEX-ZVT2-0426-SM-5E44S
50-59 years, female
2695.0
GTEX-R55G-1626-SM-48FF4
40-49 years, female
2480.2
GTEX-Y114-1826-SM-4TT87
50-59 years, female
2408.9
GTEX-11EM3-1926-SM-5987U
20-29 years, female
2340.8
GTEX-PX3G-2026-SM-48U1H
20-29 years, female
2253.3
GTEX-T6MO-1526-SM-4DM57
40-49 years, female
2250.0
GTEX-13QBU-1626-SM-5LU4S
40-49 years, female
2094.5
GTEX-T5JW-1526-SM-4DM5E
20-29 years, female
2093.1
GTEX-U3ZN-0726-SM-4DXT5
30-39 years, female
1969.8
GTEX-XUZC-0926-SM-4BOQF
30-39 years, female
1707.5
GTEX-PWN1-2026-SM-48TD9
40-49 years, female
1611.8
Show allShow less
ENDOMETRIUM - FANTOM5 CAGEi
RNA expression in human tissues obtained through Cap Analysis of Gene Expression (CAGE) generated by the FANTOM5 project are reported as Scaled Tags Per Million.
 The Human Protein Atlas project is funded


 MENU
MENU