|
TISSUE ATLASPRIMARY DATAKIDNEYGENE/PROTEIN
ANTIBODIES
AND VALIDATION 
Dictionary
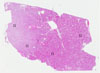
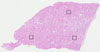
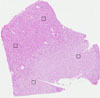
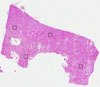
Kidney
Tissue proteome
Kidney |
|
||||||||||||||||||||||||||||||||||||||||||||||||||||||||||||||||||||||||||||||||||||||||||||||||||||||||||||
The Project
The Human Protein Atlas
 The Human Protein Atlas project is funded


 MENU
MENU