We use cookies to enhance the usability of our website. If you continue, we'll assume that you are happy to receive all cookies. More information. Don't show this again.
On the top, protein expression in current human tissue, based on all annotated cell types, is reported with the units not detected (n), low (l), medium (m) and high (h). Underneath, protein expression in each annotated cell type are reported using the same units.
Protein expression data is based on knowledge-based annotation. For genes where more than one antibody has been used, a collective score is set.
If knowledge-based annotation could not be performed for a gene, no data is displayed here. View antibody staining data further down this page.
A summary of mRNA expression data available for current tissue based on several datasets. The mRNA expression levels in human tissues are based on RNA-seq data generated by the Human Protein Atlas (HPA), Genotype-Tissue Expression (GTEx) portal and CAGE data generated by the FANTOM5 consortium. Consensus normalized expression (NX) levels for human tissues was created by combining the data from these three transcriptomics datasets (HPA, GTEx and FANTOM5).
The mRNA expression levels in pig are based on RNA-seq data generated by the Human Protein Atlas (HPA), and for mouse, HPA data and in situ hybridization generated by the Allen brain atlas are reported.
Scroll down to view mRNA expression data in more detail.
The RNA-seq details section shows detailed information about the individual samples used for the transcript profiling and results of the RNA-seq analysis.
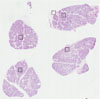
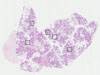
Information about each individual sample is listed below, including gender, age, a tissue section image and estimated fractions of cell types. pTPM (transcripts per million) values give a quantification of the gene abundance which is comparable between different genes and samples.
RNA-Seq data generated by the Genotype-Tissue Expression (GTEx) project from human tissues is reported as average pTPM. More information can be found on the GTEx portal.
Distribution across the dataset is visualized with box plots, shown as median and 25th and 75th percentiles. Points are displayed as outliers if they are above or below 1.5 times the interquartile range. pTPM values of the individual samples are presented next to the box plot.
Max pTPM: 2401.6
Min pTPM: 36.0
Std pTPM: 563.4
Median pTPM: 657.9
GTEX-13QBU-2126-SM-5KLZN
40-49 years, female
2401.6
GTEX-ZT9W-2126-SM-51MSF
50-59 years, male
2315.9
GTEX-14PN4-2526-SM-686ZG
50-59 years, male
2205.9
GTEX-ZQG8-2126-SM-4YCF1
60-69 years, female
2196.0
GTEX-131XF-2826-SM-5EGKH
60-69 years, male
2060.7
GTEX-145ME-1626-SM-5RQI3
40-49 years, female
1900.1
GTEX-1192X-2926-SM-5N9BA
50-59 years, male
1722.7
GTEX-1AX9K-2126-SM-72D7K
50-59 years, male
1624.1
GTEX-Y5LM-1826-SM-4VDT9
40-49 years, female
1622.3
GTEX-ZF29-2126-SM-4WWB8
60-69 years, female
1429.7
GTEX-XV7Q-2426-SM-4BRV8
40-49 years, female
1415.3
GTEX-1445S-2926-SM-5O993
60-69 years, male
1393.1
GTEX-Y3I4-1926-SM-4TT8L
50-59 years, male
1379.6
GTEX-Y5V6-2226-SM-4VDTC
60-69 years, male
1334.3
GTEX-X5EB-1726-SM-4E3J7
40-49 years, male
1300.0
GTEX-15EU6-2626-SM-7KUN4
50-59 years, male
1298.3
GTEX-13QJC-2326-SM-5Q5CD
60-69 years, female
1234.2
GTEX-1339X-2326-SM-5HL5B
40-49 years, male
1162.4
GTEX-12BJ1-2226-SM-5BC6G
60-69 years, male
1144.9
GTEX-11ZTS-3026-SM-5EQM7
60-69 years, female
1127.4
GTEX-11WQK-2926-SM-5EQKT
50-59 years, male
1111.4
GTEX-WFJO-2026-SM-4LVM3
30-39 years, male
1106.0
GTEX-146FR-1226-SM-5SIA7
60-69 years, female
1082.0
GTEX-14PJ3-1526-SM-664O9
50-59 years, male
1067.9
GTEX-1CB4I-2526-SM-7MKG1
50-59 years, male
1065.9
GTEX-WY7C-1426-SM-4OND1
50-59 years, male
1063.5
GTEX-131XH-2626-SM-5GCNP
50-59 years, male
1024.1
GTEX-ZP4G-1926-SM-57WDZ
20-29 years, female
1012.5
GTEX-ZA64-1726-SM-5CVMF
20-29 years, male
1011.2
GTEX-1C64O-0626-SM-7DHL1
60-69 years, male
996.8
GTEX-11TUW-2426-SM-5EQKB
60-69 years, male
959.2
GTEX-WH7G-2126-SM-4M1XU
40-49 years, male
956.8
GTEX-15CHC-1226-SM-686ZH
60-69 years, female
942.5
GTEX-18QFQ-0626-SM-718AW
30-39 years, male
937.4
GTEX-13113-1526-SM-5EGHV
60-69 years, female
927.7
GTEX-ZPU1-2326-SM-57WEP
40-49 years, male
921.5
GTEX-YB5K-1726-SM-5IFIZ
40-49 years, female
866.6
GTEX-13111-2326-SM-5LZUQ
50-59 years, male
849.6
GTEX-WOFM-2126-SM-4OOSR
20-29 years, male
816.5
GTEX-1EH9U-2926-SM-7DHLX
60-69 years, male
813.7
GTEX-ZC5H-2726-SM-5KLZW
40-49 years, female
791.3
GTEX-18A7B-2826-SM-7KFTK
70-79 years, male
771.6
GTEX-11EQ9-2026-SM-5P9JI
30-39 years, male
751.6
GTEX-13OVI-2326-SM-5KM47
60-69 years, female
731.4
GTEX-13O21-1926-SM-5MR39
50-59 years, male
705.6
GTEX-17MFQ-1626-SM-7938Z
20-29 years, male
694.4
GTEX-ZXG5-2826-SM-5NQ8T
60-69 years, male
665.5
GTEX-1GPI7-0326-SM-7MKH6
20-29 years, male
664.8
GTEX-11EMC-2526-SM-5PNVU
60-69 years, female
657.9
GTEX-YF7O-2226-SM-5CVN8
50-59 years, male
643.6
GTEX-17KNJ-2726-SM-7KFRE
50-59 years, male
638.6
GTEX-18A67-0626-SM-7KFSL
50-59 years, male
633.9
GTEX-11ZTT-2226-SM-5CVLP
60-69 years, female
594.0
GTEX-1117F-3026-SM-5GZYU
60-69 years, female
576.9
GTEX-WHSB-2326-SM-4M1XK
50-59 years, male
571.6
GTEX-1B97J-2126-SM-79OL6
50-59 years, female
555.6
GTEX-14B4R-1426-SM-5Q5CG
30-39 years, male
549.1
GTEX-12WSL-2126-SM-5GCNG
50-59 years, male
544.1
GTEX-13JVG-2926-SM-5J2N9
60-69 years, male
525.2
GTEX-1GMR2-2026-SM-7MKHK
50-59 years, male
524.1
GTEX-X261-2426-SM-4PQZU
50-59 years, male
502.9
GTEX-18D9U-2226-SM-7KFTN
40-49 years, male
460.9
GTEX-11P81-2026-SM-5P9GT
30-39 years, female
454.9
GTEX-14E1K-2626-SM-664OJ
50-59 years, male
434.1
GTEX-X15G-2126-SM-4PQZR
50-59 years, female
408.1
GTEX-12WSN-2226-SM-5DUXT
40-49 years, male
377.0
GTEX-1AMEY-1126-SM-72D79
30-39 years, female
364.9
GTEX-14PJN-1726-SM-69LO7
30-39 years, male
357.7
GTEX-15RJE-2726-SM-6LPJ1
40-49 years, male
353.1
GTEX-X3Y1-1926-SM-4PQZO
40-49 years, male
293.7
GTEX-XGQ4-2626-SM-4AT6B
50-59 years, male
288.8
GTEX-12WSM-1826-SM-5BC64
60-69 years, male
274.8
GTEX-1B932-0626-SM-731EM
40-49 years, female
272.7
GTEX-15SHV-2226-SM-6M464
60-69 years, male
252.1
GTEX-XMK1-2626-SM-4B65R
40-49 years, male
246.6
GTEX-1314G-2026-SM-5LZUM
30-39 years, male
245.4
GTEX-14JIY-3026-SM-6EU1R
60-69 years, male
197.8
GTEX-ZQUD-2126-SM-51MSY
30-39 years, male
193.7
GTEX-178AV-1426-SM-6LLID
40-49 years, male
190.7
GTEX-11P82-0926-SM-5986X
20-29 years, male
189.0
GTEX-13OVK-1826-SM-6PALE
40-49 years, male
183.8
GTEX-111FC-2926-SM-5GZY7
60-69 years, male
173.2
GTEX-13CF2-2426-SM-5LZYL
60-69 years, male
166.3
GTEX-1A3MV-1726-SM-72D68
30-39 years, male
164.7
GTEX-1AX8Z-0626-SM-731EH
60-69 years, male
164.3
GTEX-1B8KZ-1726-SM-73KV7
50-59 years, male
136.1
GTEX-ZE7O-2926-SM-51MSG
50-59 years, female
125.6
GTEX-13G51-2426-SM-5LZY8
60-69 years, male
108.0
GTEX-WYVS-2026-SM-4RGNS
40-49 years, female
106.3
GTEX-13VXT-1726-SM-5IFF5
20-29 years, female
91.9
GTEX-11NV4-1926-SM-5N9D4
60-69 years, male
88.3
GTEX-1B8SF-1826-SM-731DJ
60-69 years, male
88.0
GTEX-Y111-2626-SM-4TT24
50-59 years, male
65.6
GTEX-1C64N-2926-SM-79OLM
50-59 years, male
64.6
GTEX-1C4CL-2026-SM-731EB
30-39 years, male
39.6
GTEX-13NYB-2426-SM-5IFF4
40-49 years, male
37.6
GTEX-13OVL-2926-SM-5IFG3
50-59 years, male
36.0
Show allShow less
SALIVARY GLAND - FANTOM5 CAGEi
RNA expression in human tissues obtained through Cap Analysis of Gene Expression (CAGE) generated by the FANTOM5 project are reported as Scaled Tags Per Million.
 The Human Protein Atlas project is funded


 MENU
MENU